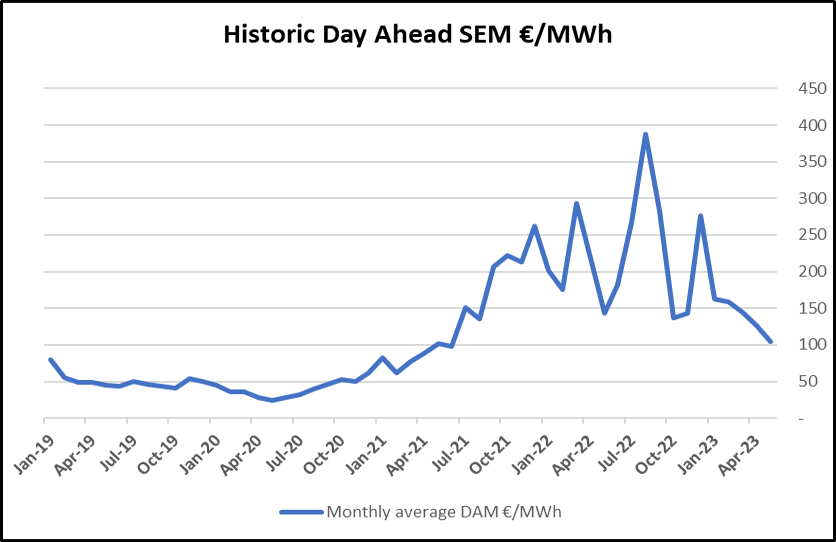
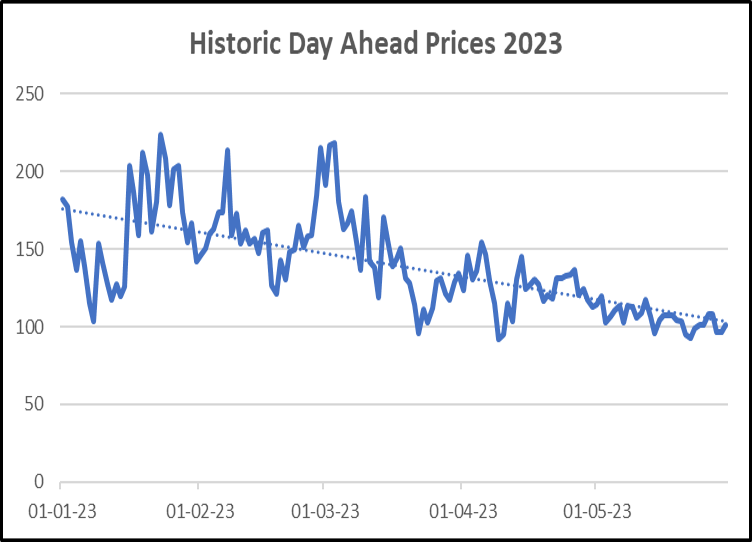
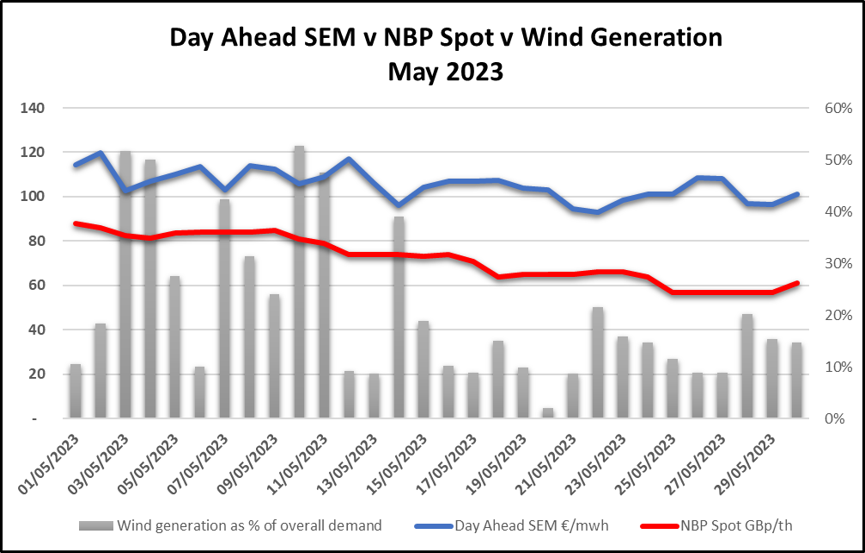
Average power prices have fallen every month in 2023 so far. Average prices in the SEM Day Ahead fell ~16% month-on-month. May outturn was €105/MWh, compared to €126 in April.
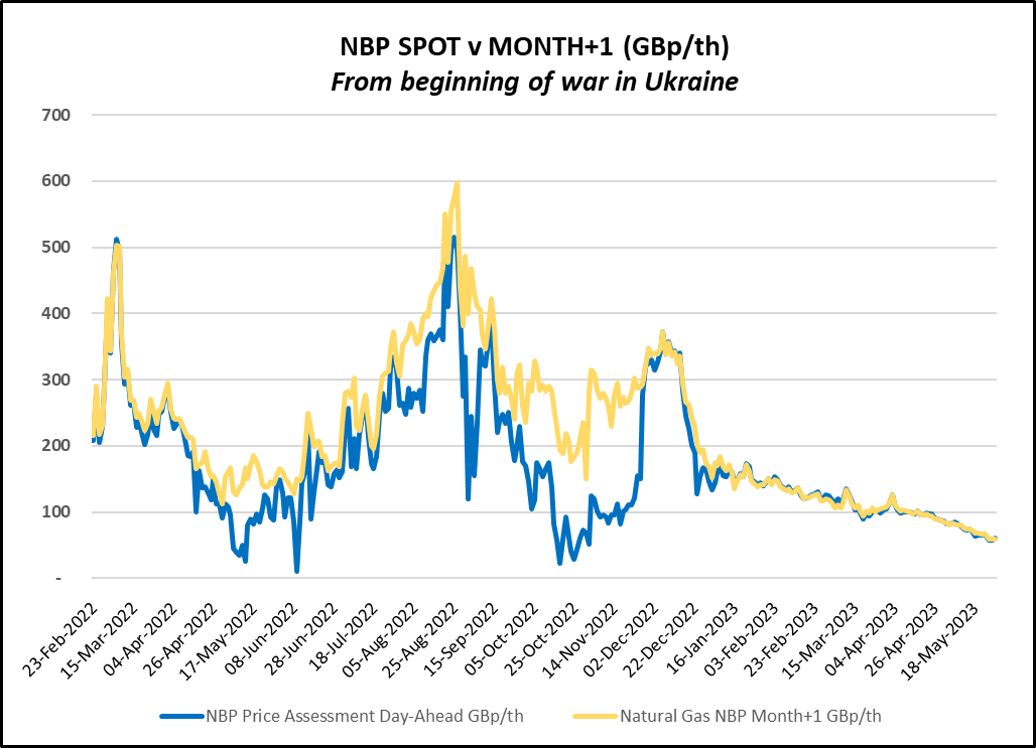
British gas prices fell consistently across the month. The May average NBP was very close to a two-year low, similar to levels last seen in May 2021.
Gas – Pricing & Supply
- NBP near curve price volatility was muted in May, while prices continued to decline, as can be seen in the graph below.
- Prices for 2023 gas deliveries are reverting to pre-pandemic and energy crisis levels but a heavier weighting of risk has now shifted to 2024 contracts. We will explore this trend later in the review..
Gas – Consumption & Storage
- EU aggregated storage levels were at an all time high in early April and they have remained at the higher end of historic averages throughout 2023 so far. See chart below, obtained from ICIS.
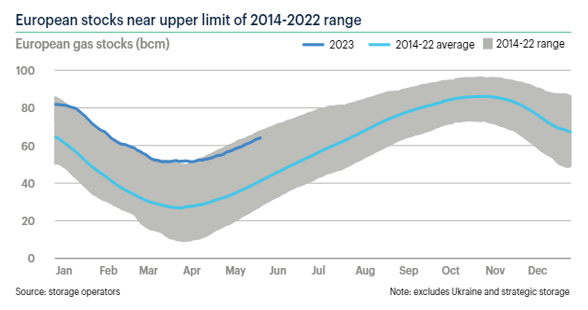
- European storage levels are 66% full at end May, 25 percentage points higher than 2022.
- 90% storage targets by 1 November are achievable even without Russian pipped gas, that was available at this time in 2022.
- Gas demand has been lower than average of late. See chart below, obtained from ICIS. This will help to get those storage sites filled up during refilling season.
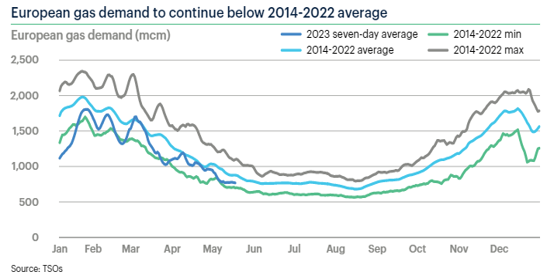
- However, the question is now being asked; can gas injection rates of early 2023 remain, as gas prices are now below Asian levels therefore making Asian delivery more attractive for LNG.
Renewables
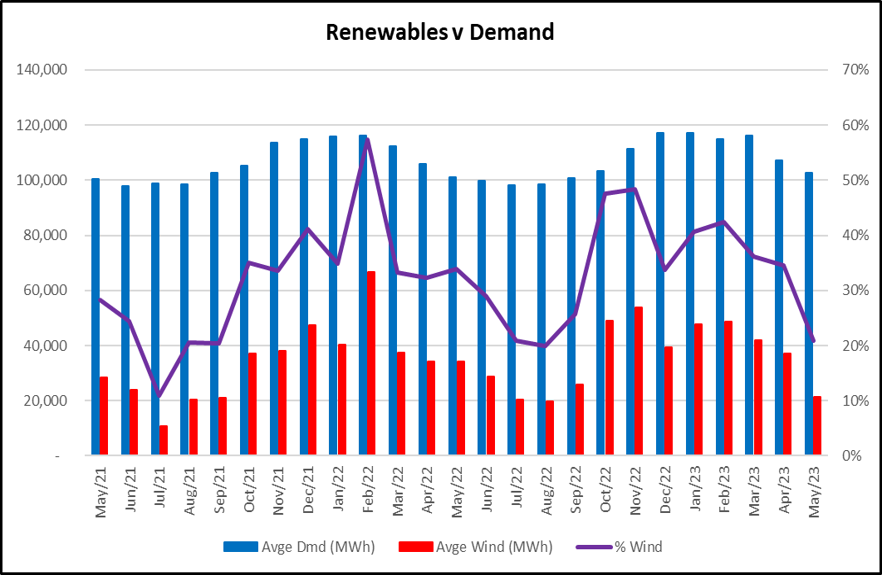
Wind generation was relatively low in May and contributed an average of just 21% of the Irish Generation Mix across the month.
This compares with an average of 31% across May ‘21 & May ‘22. See graph below.
Even when the wind was particularly low in the second half of the month, power prices stayed low, due to ever falling spot gas prices. See graph below.
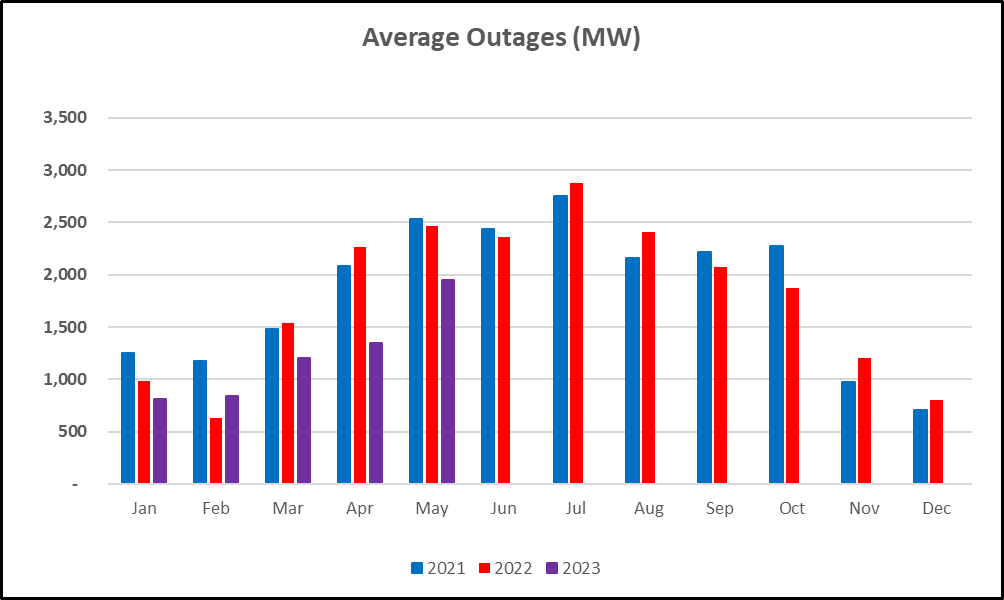
Generation Capacity
- Outages in May ‘23 were considerably lower than the previous 2 comparative periods for the third month in succession.
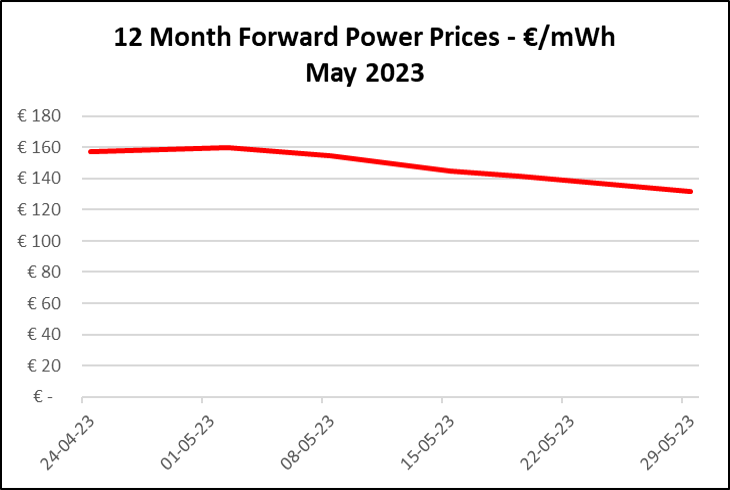
Forecasts – Power Forward Prices
- Forward prices have fallen significantly since the turn of the year and have continued that trend in May. By the end of May the forward price sits just over €132/mwh, levels not seen since September 2021, well in advance of the Ukrainian war.
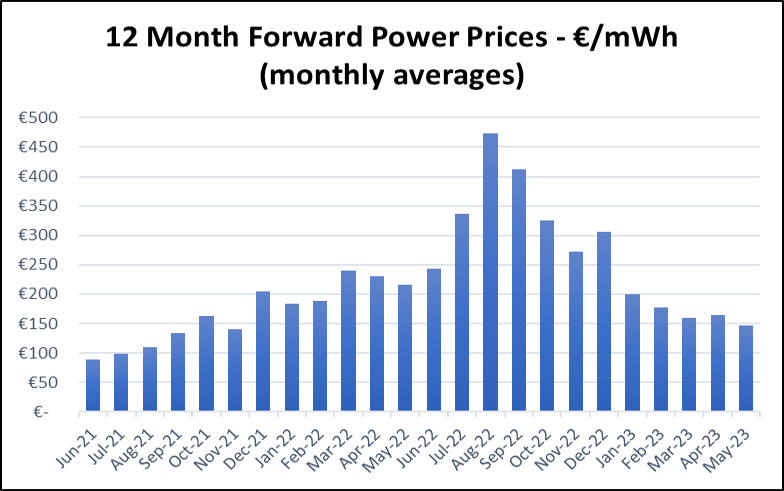
- As the war in Ukraine rumbles on, a high level of risk premium remains in energy markets, particularly for Winter 2023 into 2024. There are a number of factors at play, such as an uncertain international geopolitical situation, weather, and the newly evolving web of energy supply chains.
- Forward prices are now approximately 2x the previously accepted norms.
- It is key to understand that European buyers are now unwilling to sign the kind of long-term gas purchasing contracts that Asian countries are committing to. This is because current green energy targets suggest that overall gas requirement in Europe will fall significantly within this decade.
- This leaves European gas prices open to the risks of the international spot market for LNG. An elevated risk premium is sure to remain in forward power prices, such as those in Ireland, that are often determined by the price of gas generation.
- The heavier portion of that risk premium has now switched further out along the price curve, to 2024. However, some market participants have expressed caution on current 2023 price levels, noting a slow down of injection rates at gas storage sites recently.
- While EU gas storage levels are near all time highs, if injection rates are not restored to the required scale, this could cause another panic late in refilling season as sites push to reach 90% mandated gas storage levels.
- Global gas prices are expected to remain structurally high until at least 2026, after which there are a number of pending infrastructure projects due be completed, bringing more capacity online.
- These projects include Qatar’s North Field expansion and an assortment of new US LNG export projects, which have just recently entered construction.
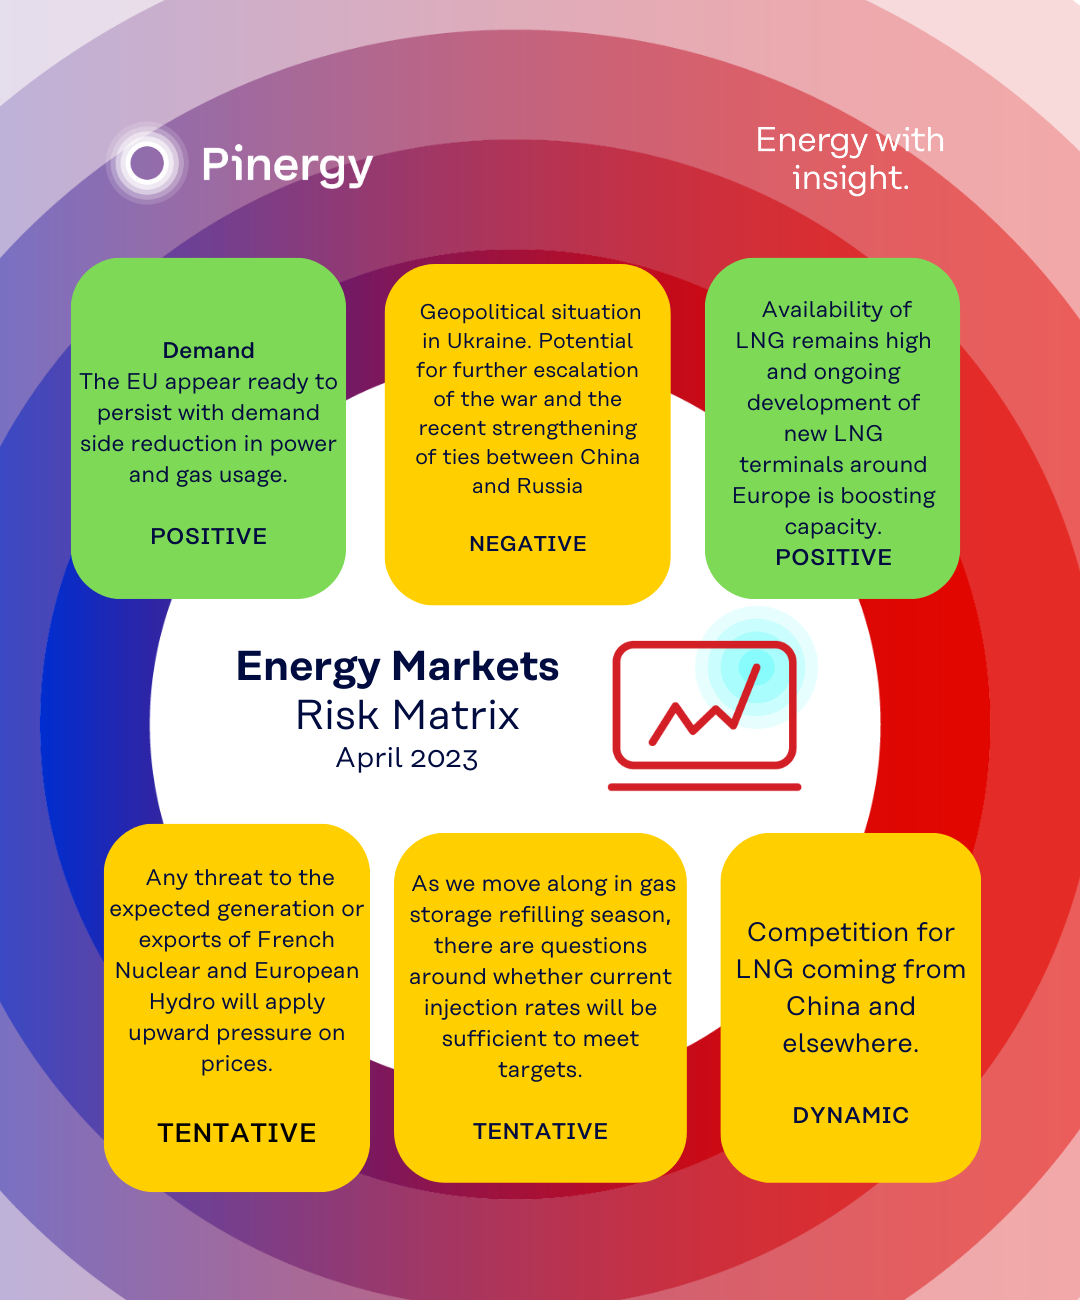
Pinergy Risk Matrix
We have compiled a list of the key factors we feel have the highest potential to influence power prices over the coming 12 months and rated as follows:
Green = Price reducing impact and highly probable.
Amber = Risk of increased power prices and of lower concern.
Red = Significant risk to 12 month forward price outlook, with medium to high probability.